01
Level of Investment Risk
Estimated number of negative annual returns over any 20-year period is 4 to less than 6.
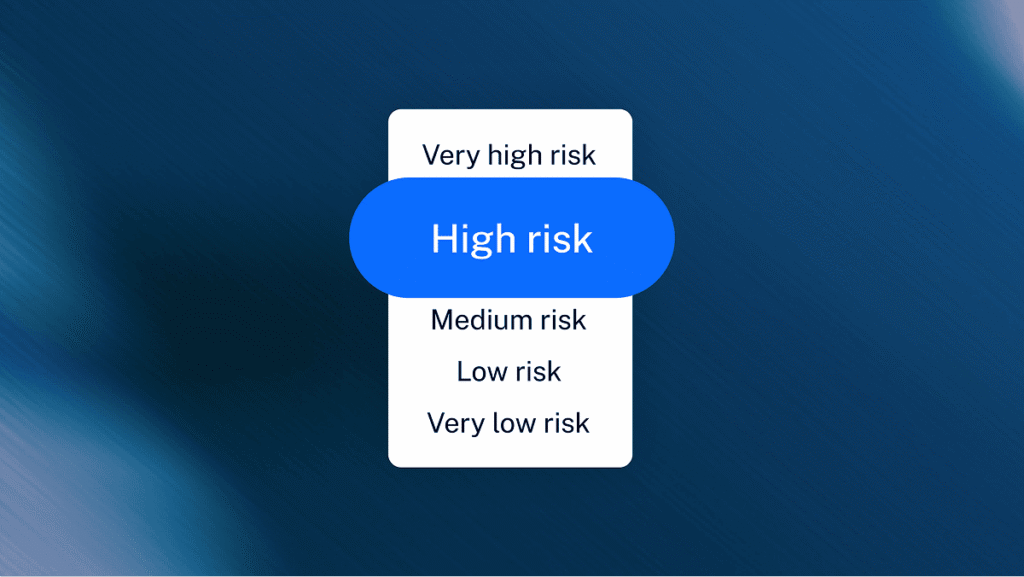

This product dashboard provides members with key information about the fund’s fees, risk and performance. You can use this dashboard to compare Superhero MySuper Growth with other MySuper products.
01
Estimated number of negative annual returns over any 20-year period is 4 to less than 6.
02
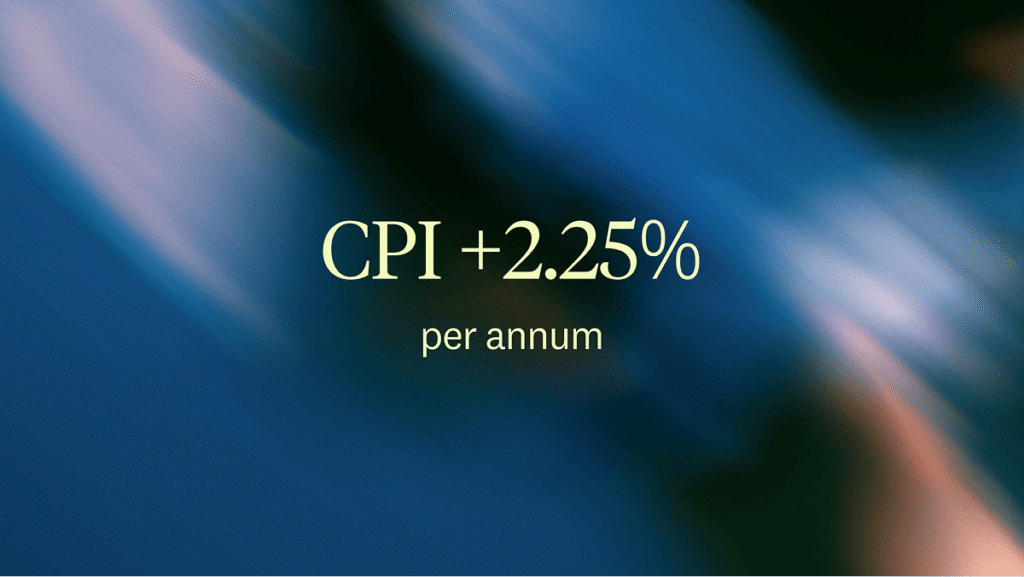
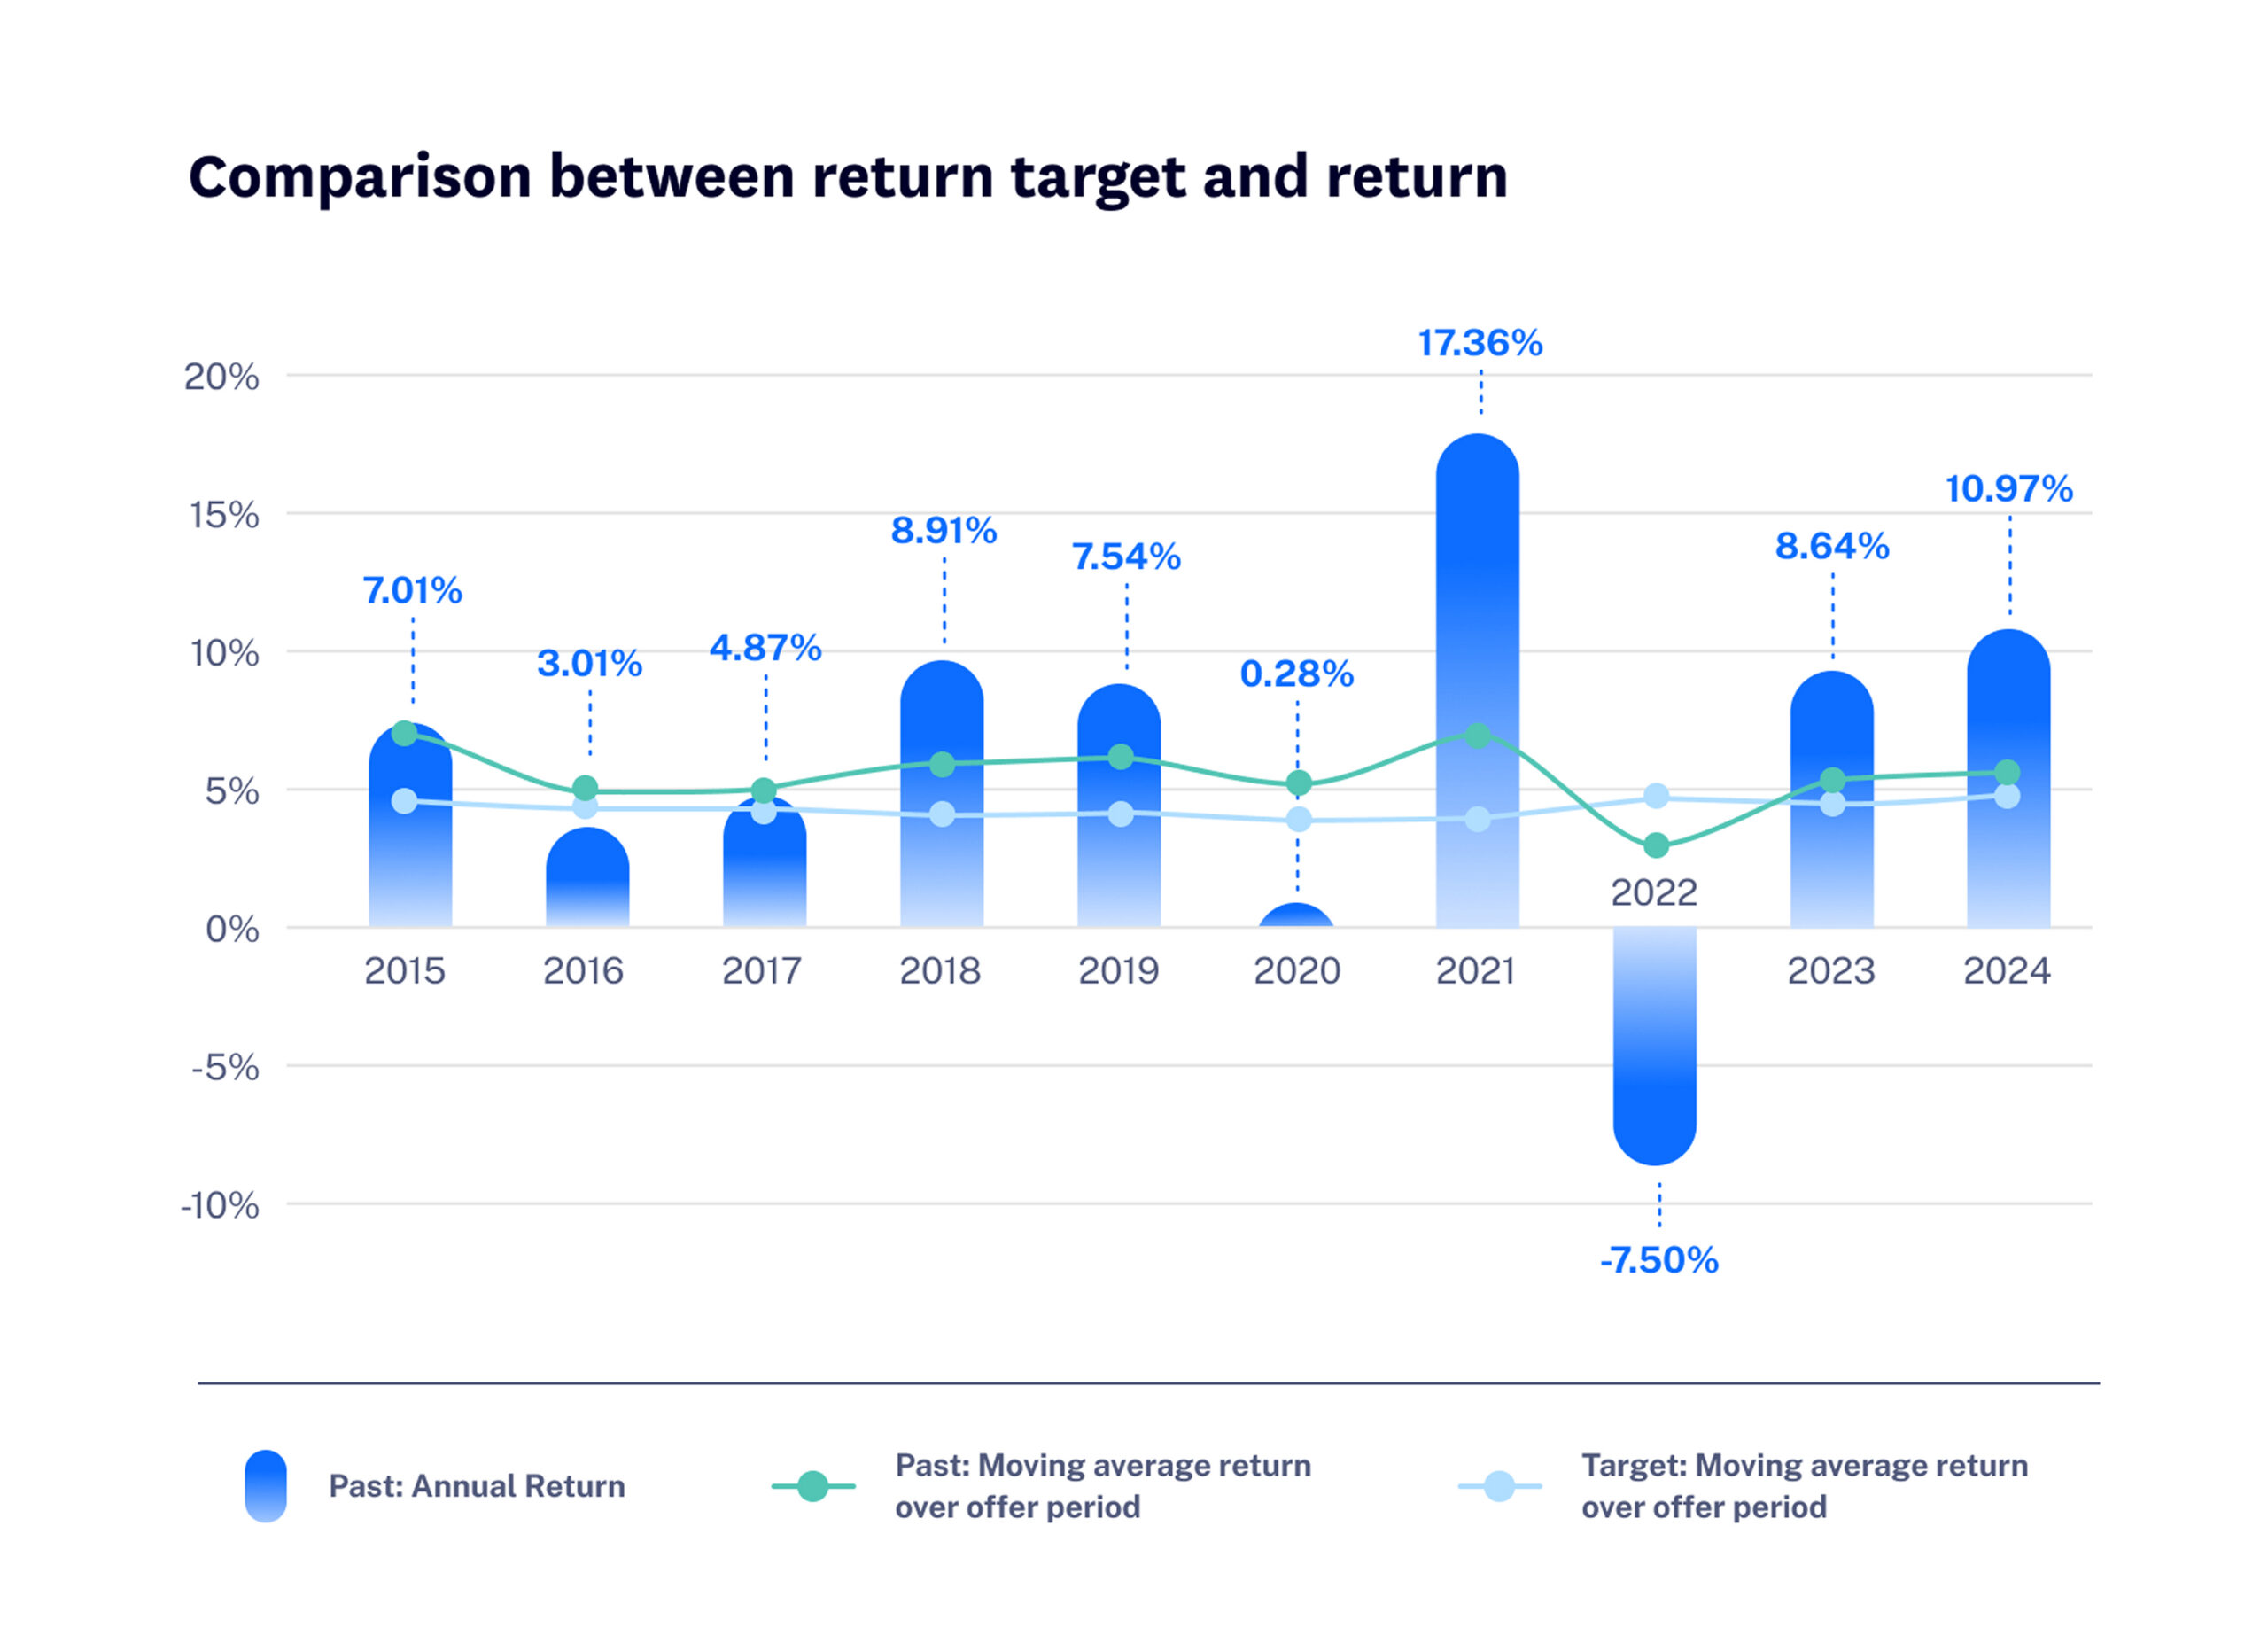
To provide a net return after tax and investment costs equal or better than inflation (CPI) + 2.25% p.a. for the period 2025-2034. The return target is an estimate of the expected return above inflation over a ten year period for the investment option after taxes, fees and costs.
03
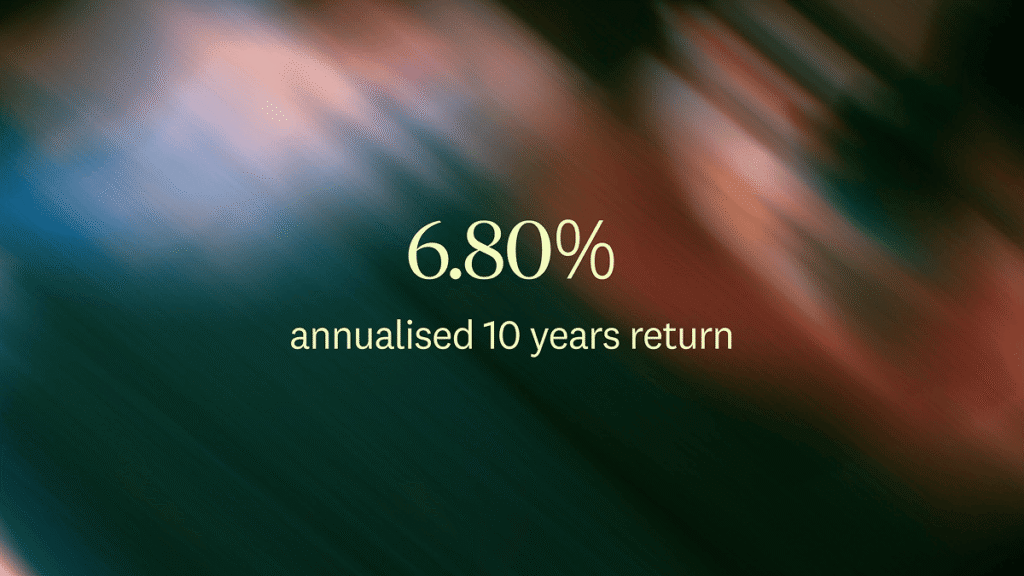
Ten year average annual return of 6.80% as at 31 July 2025.
04
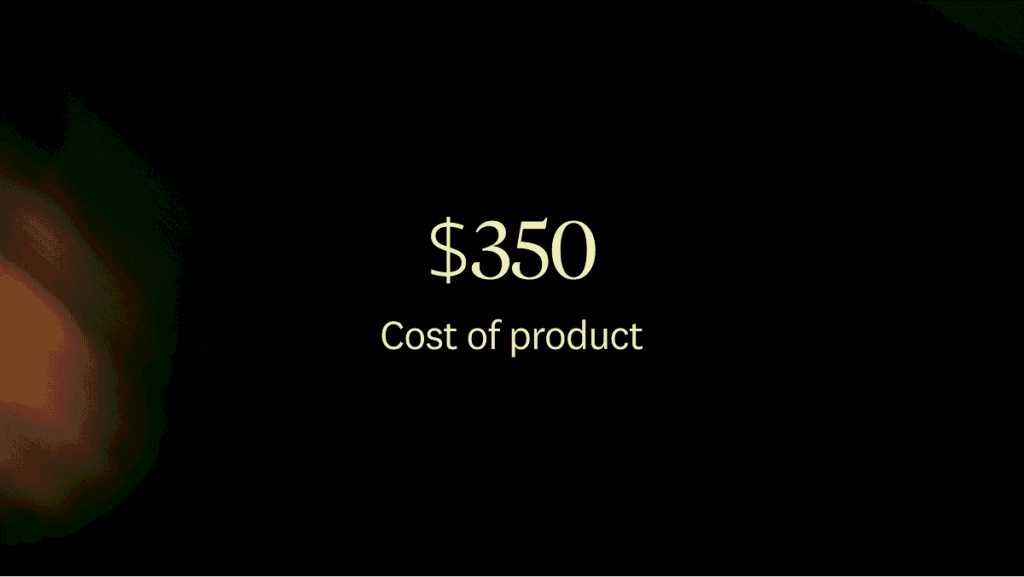
Fees and other costs for a representative member who is fully invested in the product, has a $50,000 balance for the year and incurs no activity fees. This may not represent your personal situation.
| Financial Year | Return |
|---|---|
| 2024 | 10.97% |
| 2023 | 8.64% |
| 2022 | -7.50% |
| 2021 | 17.36% |
| 2020 | 0.28% |
| 2019 | 7.54% |
| 2018 | 8.91% |
| 2017 | 4.87% |
| 2016 | 3.01% |
| 2015 | 7.01% |
| 2014 | N/A |
| 2013 | N/A |
| 2012 | N/A |
$350
The statement of fees and other costs for a representative member who is fully invested in MySuper, who doesn’t incur any activity fees during the year and who has an account balance of $50,000 balance throughout that year. It excludes investment gains / losses on the $50,000 balance. Fees and costs reported are Administration Fees, Investment Fees and Costs, refer to the PDS and Additional Information Booklet for more information about Fees and Costs. Warning: the information in this dashboard follows specific statutory requirements and, for this reason, may not be identical to information disclosed in previous annual member statements or in Annual Reports.
1 The return target is calculated using a net return of a representative member. A representative member is a member who is fully invested in the investment option, who does not incur any activity fees during a year and who has an account balance of $50,000 throughout that year. Excludes: investment gains/losses on the $50,000 balance. Return is not the same as investment performance stated in disclosure or website. Legislation requires the Return to be calculated net of taxes, investment fees and costs, transaction costs and administration fees and costs for a member with a $50,000 balance.